Sun Protection Infographic
In this project, the information visualisation is created in the form of a static information graphic. The data was provided by the Australian Drug and Alcohol Survey called "Australian Secondary Students - Sun Protection". The task here is to consider the data, reflect on the content and then consider and create an appropriate way to present the data to a wider audience. This infographic allows people to understand it at a glance and has the right combination of images and words. It successfully tells a story by the placement of information against the visual back drop.
You may also like
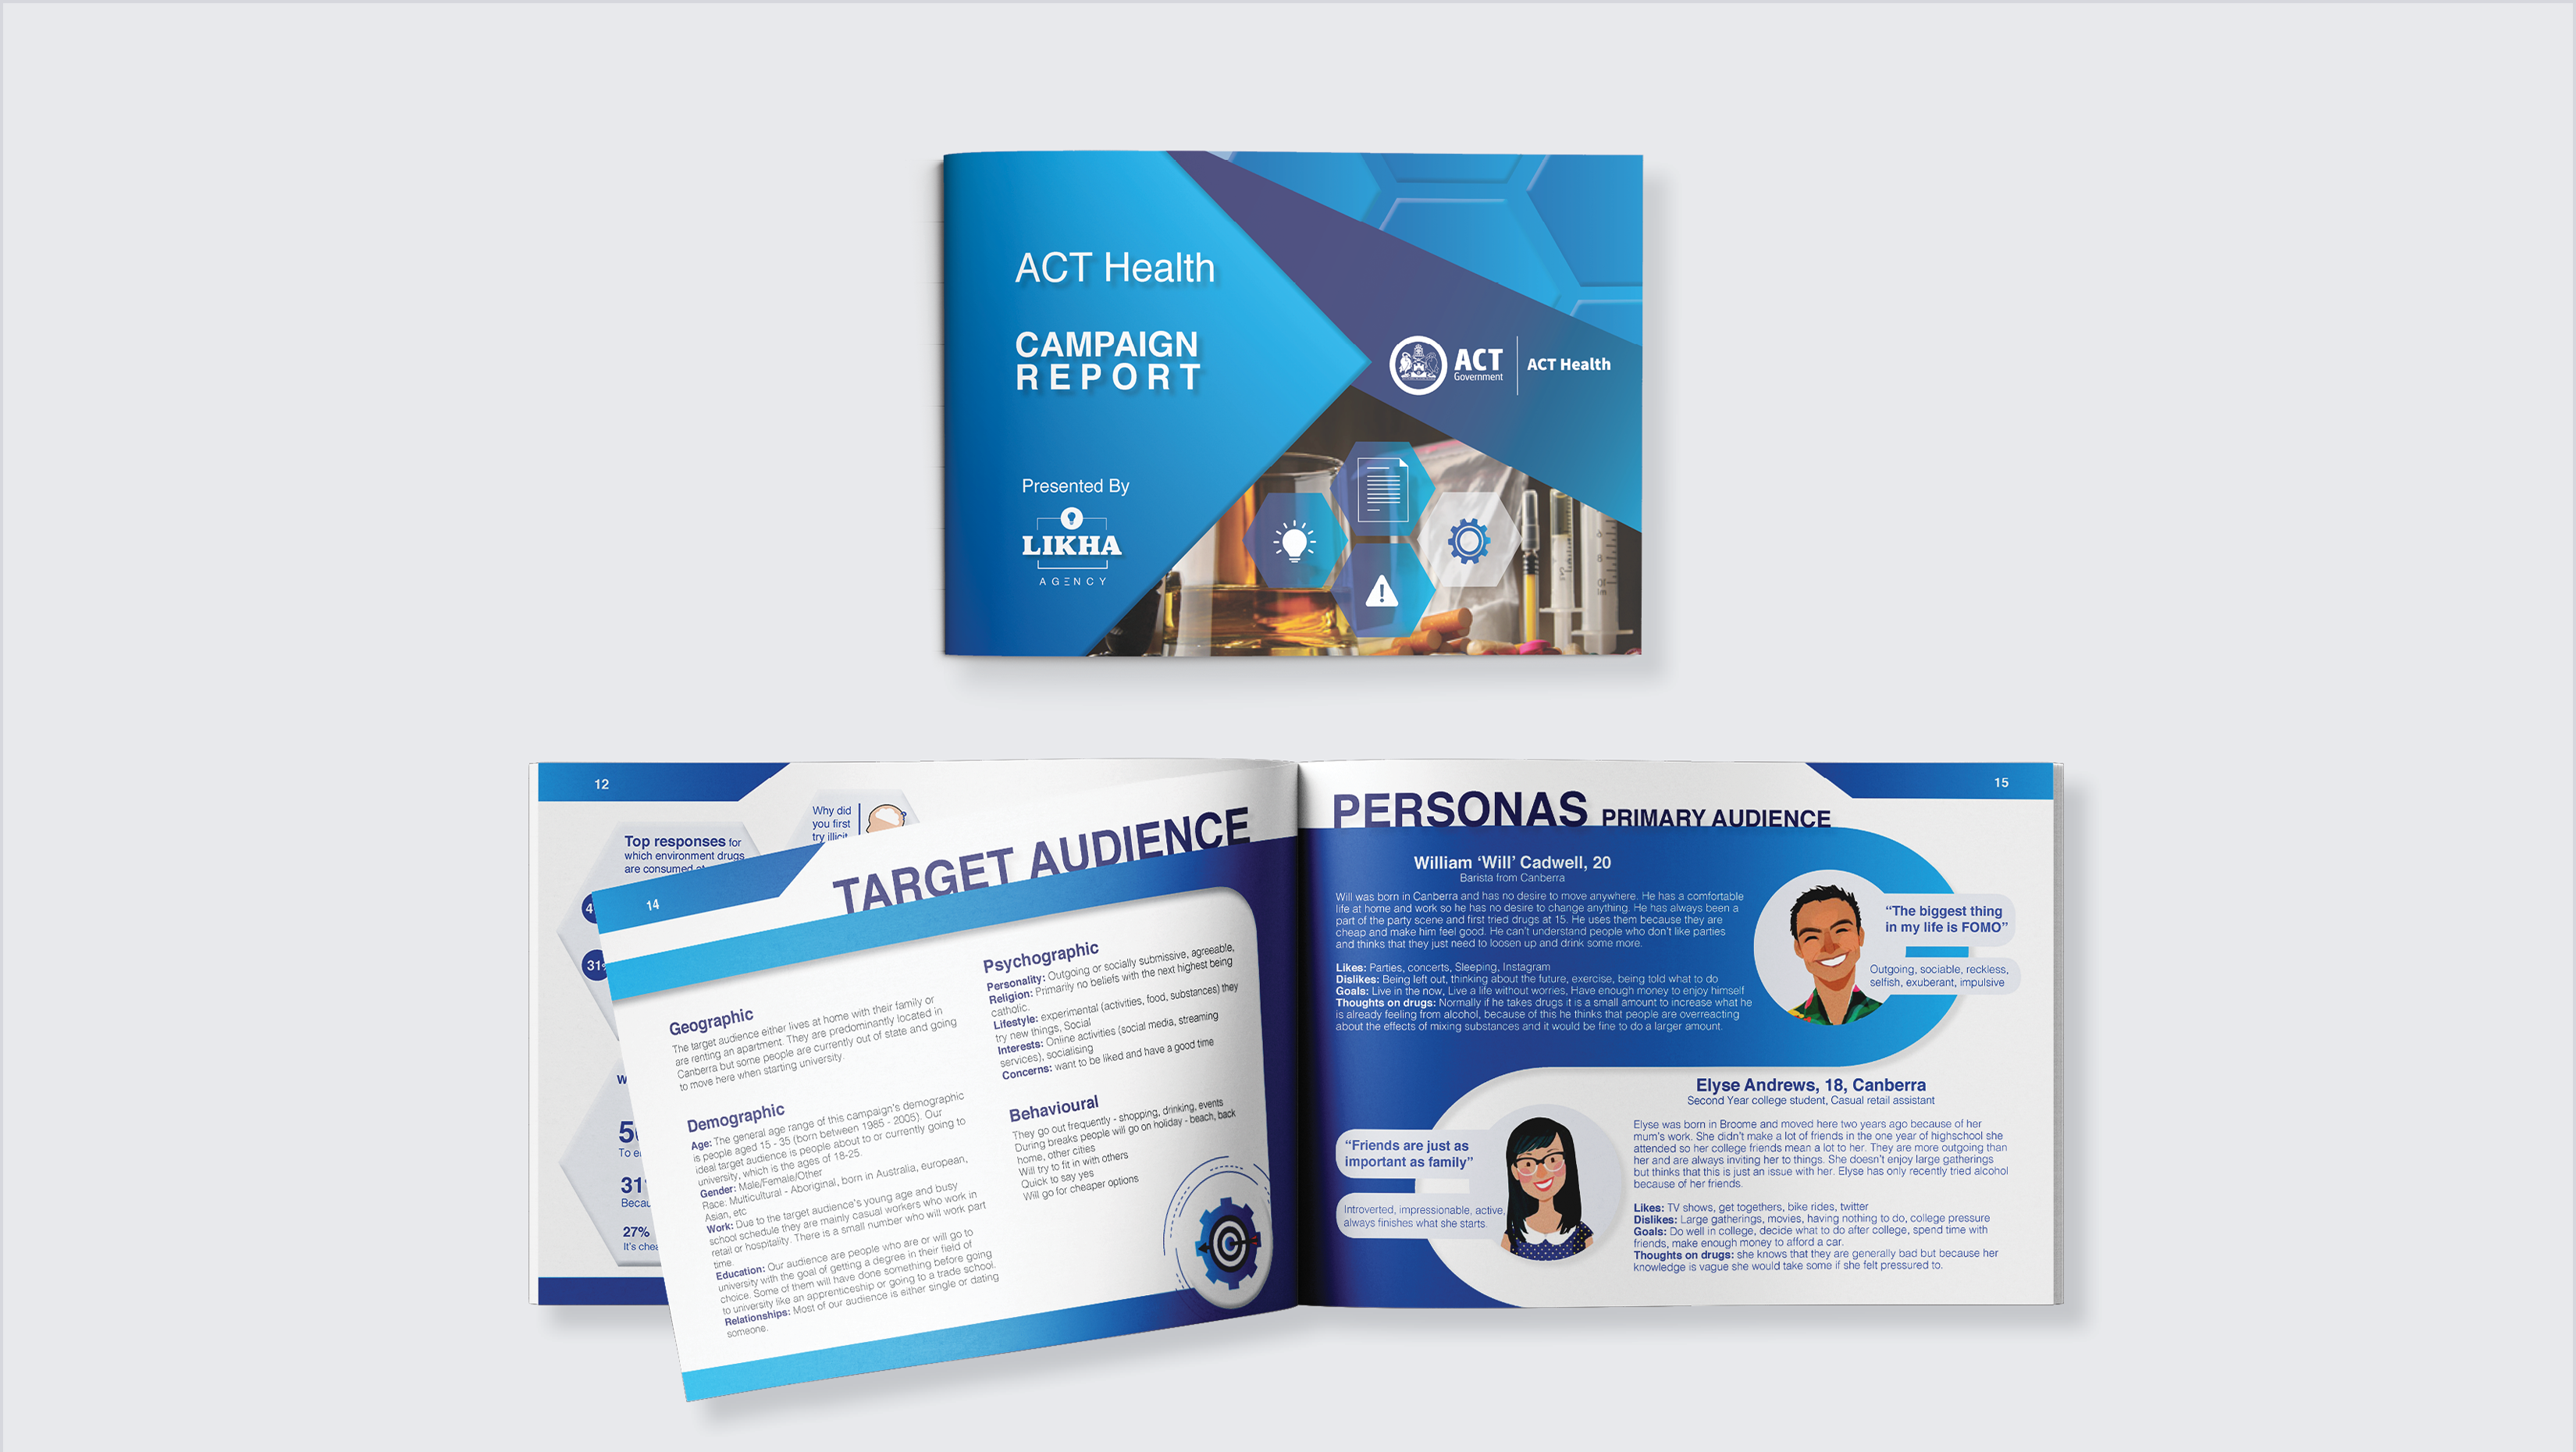
ACT Health Campaign Report
2020
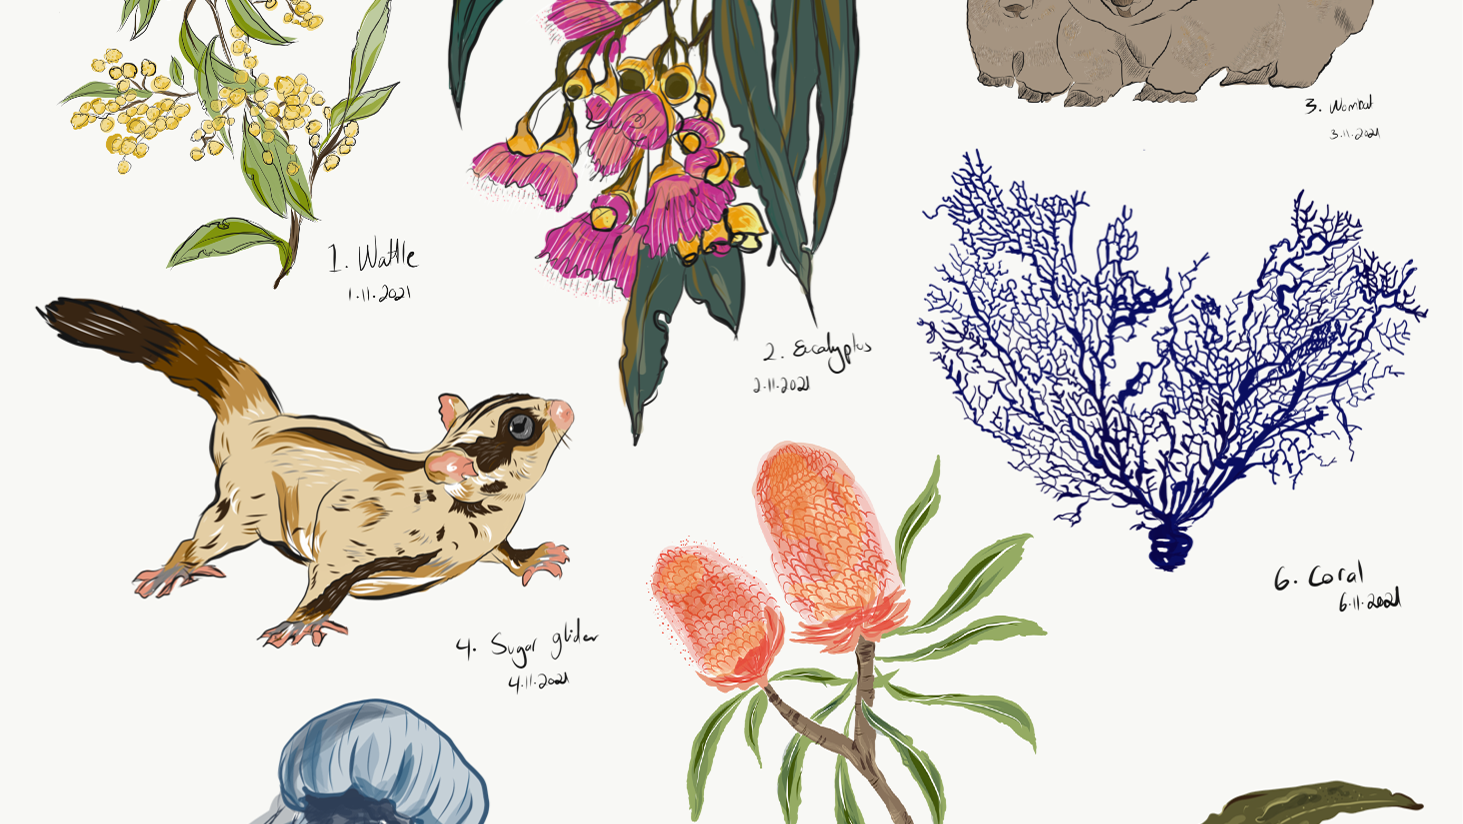
November Challenge
2022
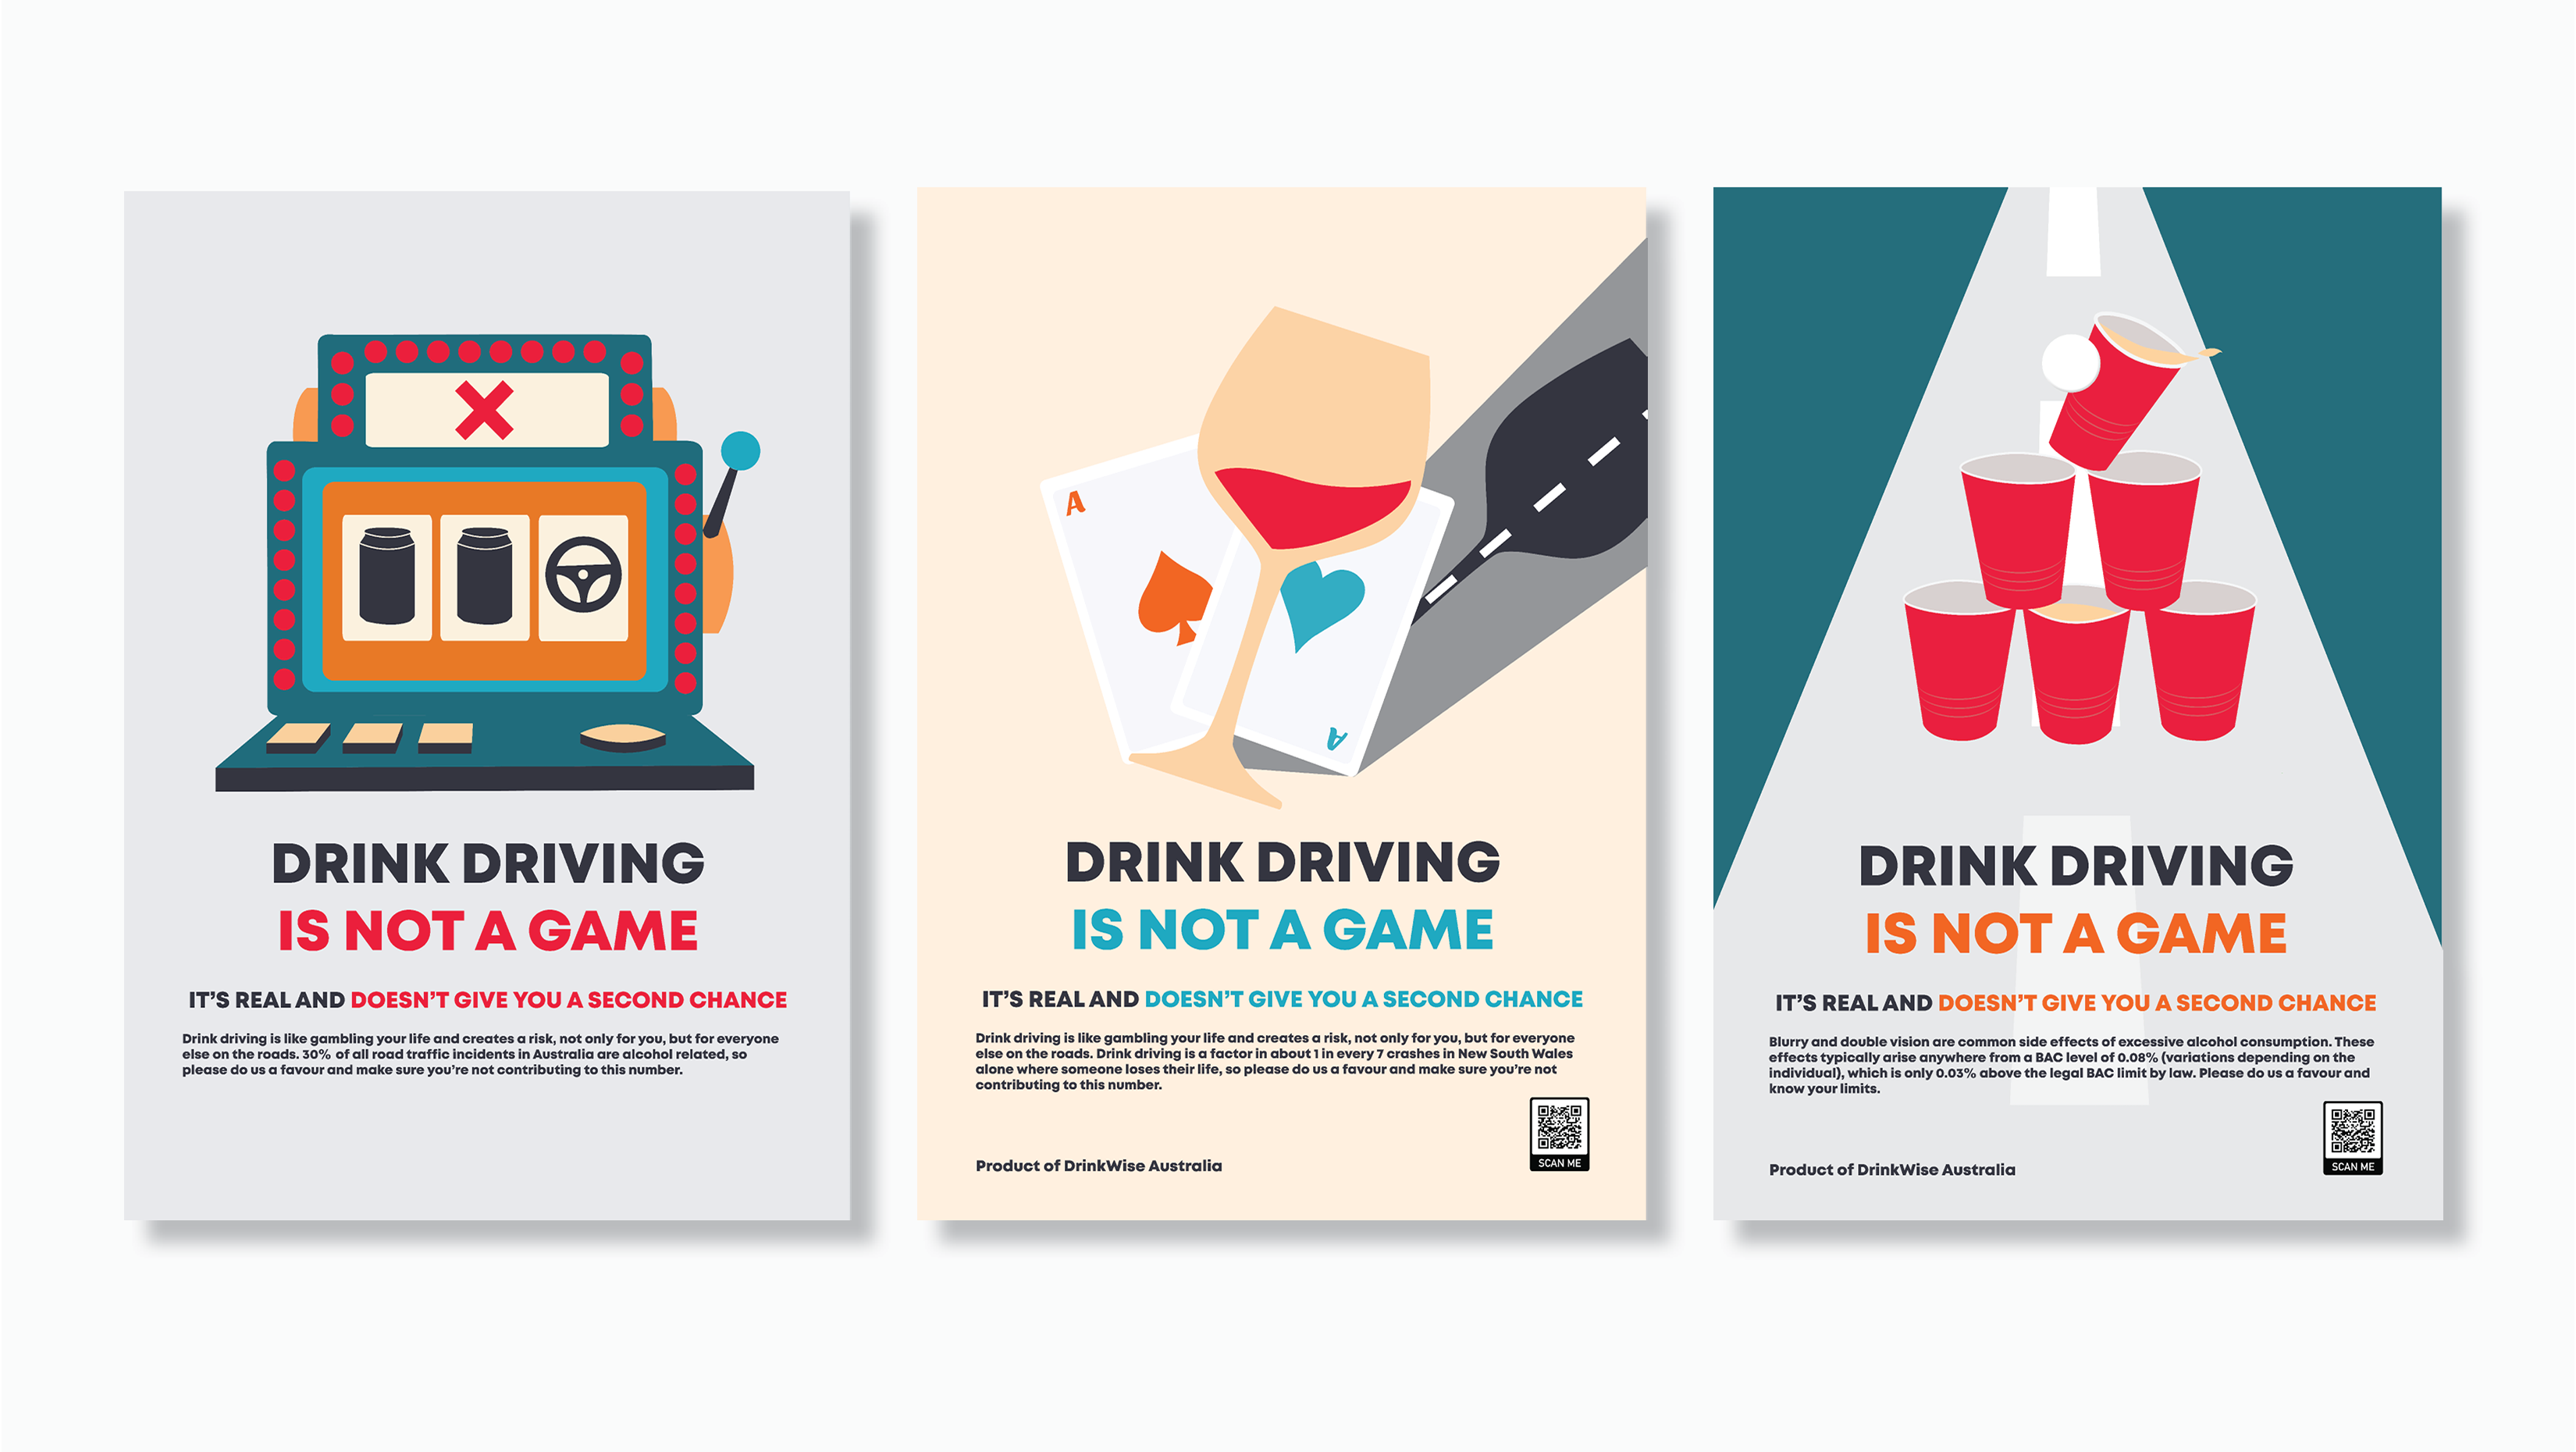
Anti-Drink Driving Social Marketing Campaign
2020

"Dancing Plants" Motion Graphics
2018

5 Tarot Card Designs
2019
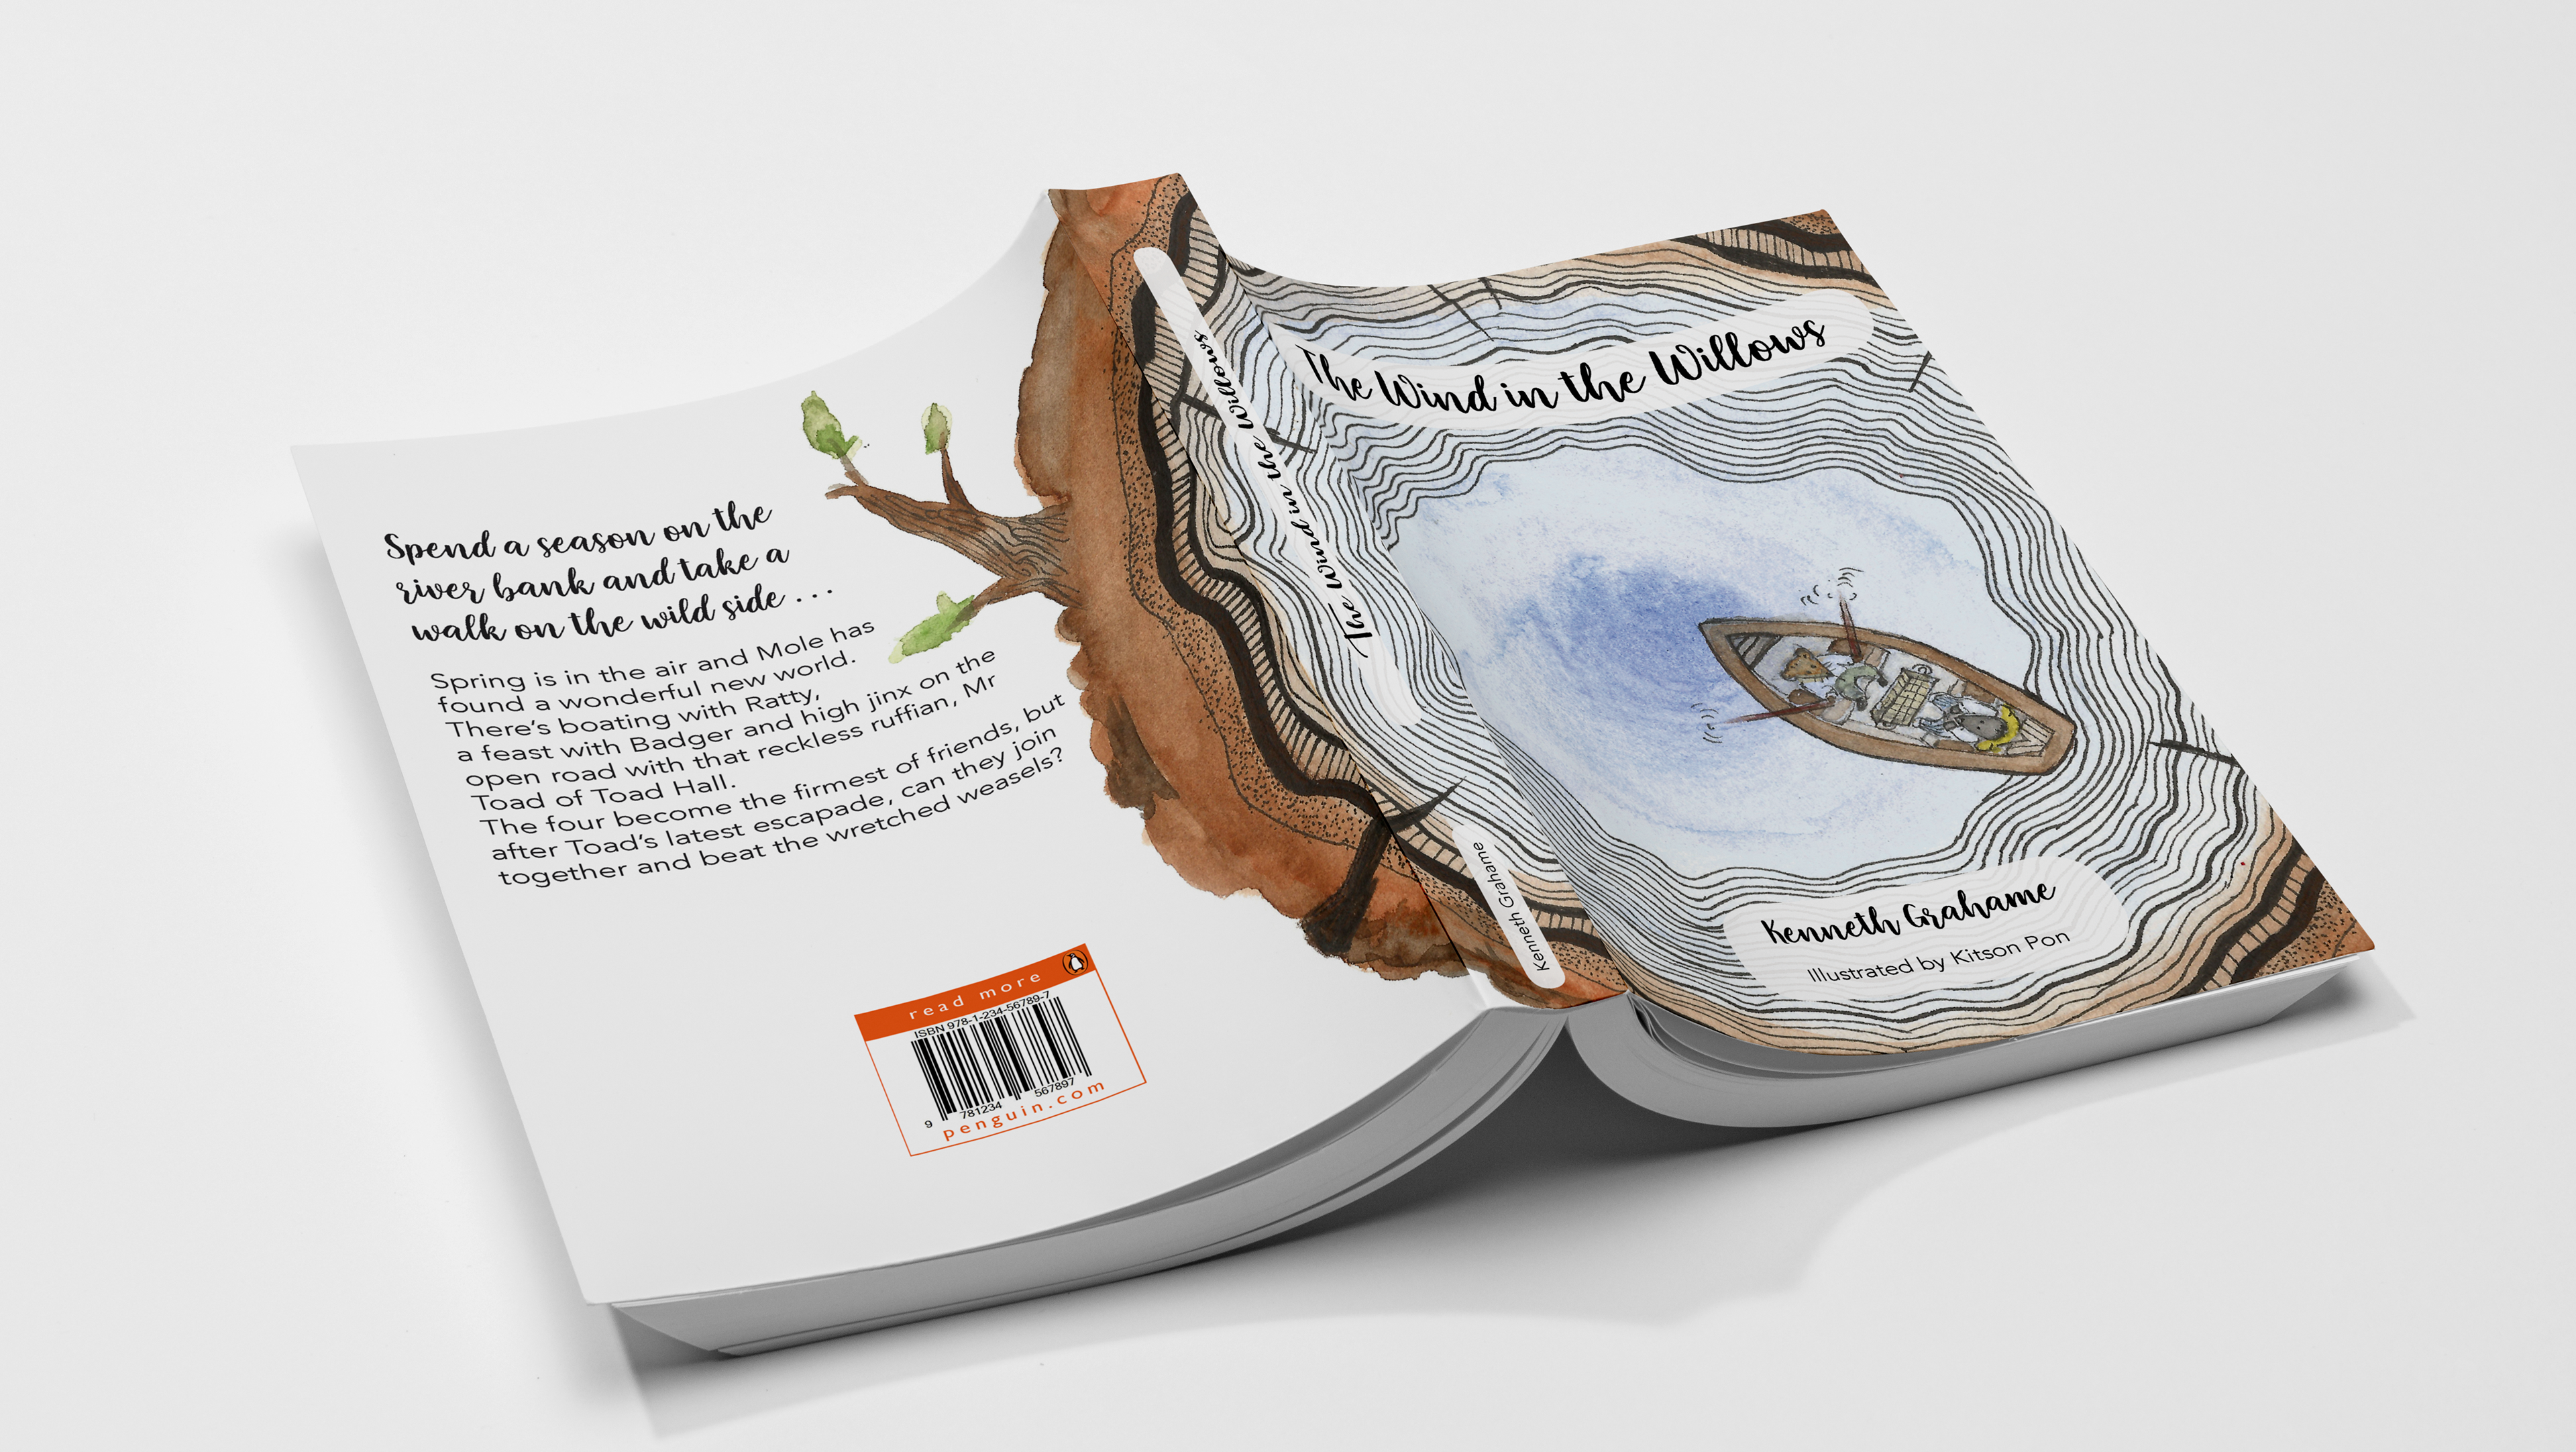
"The Wind in the Willows" Publication Design
2018
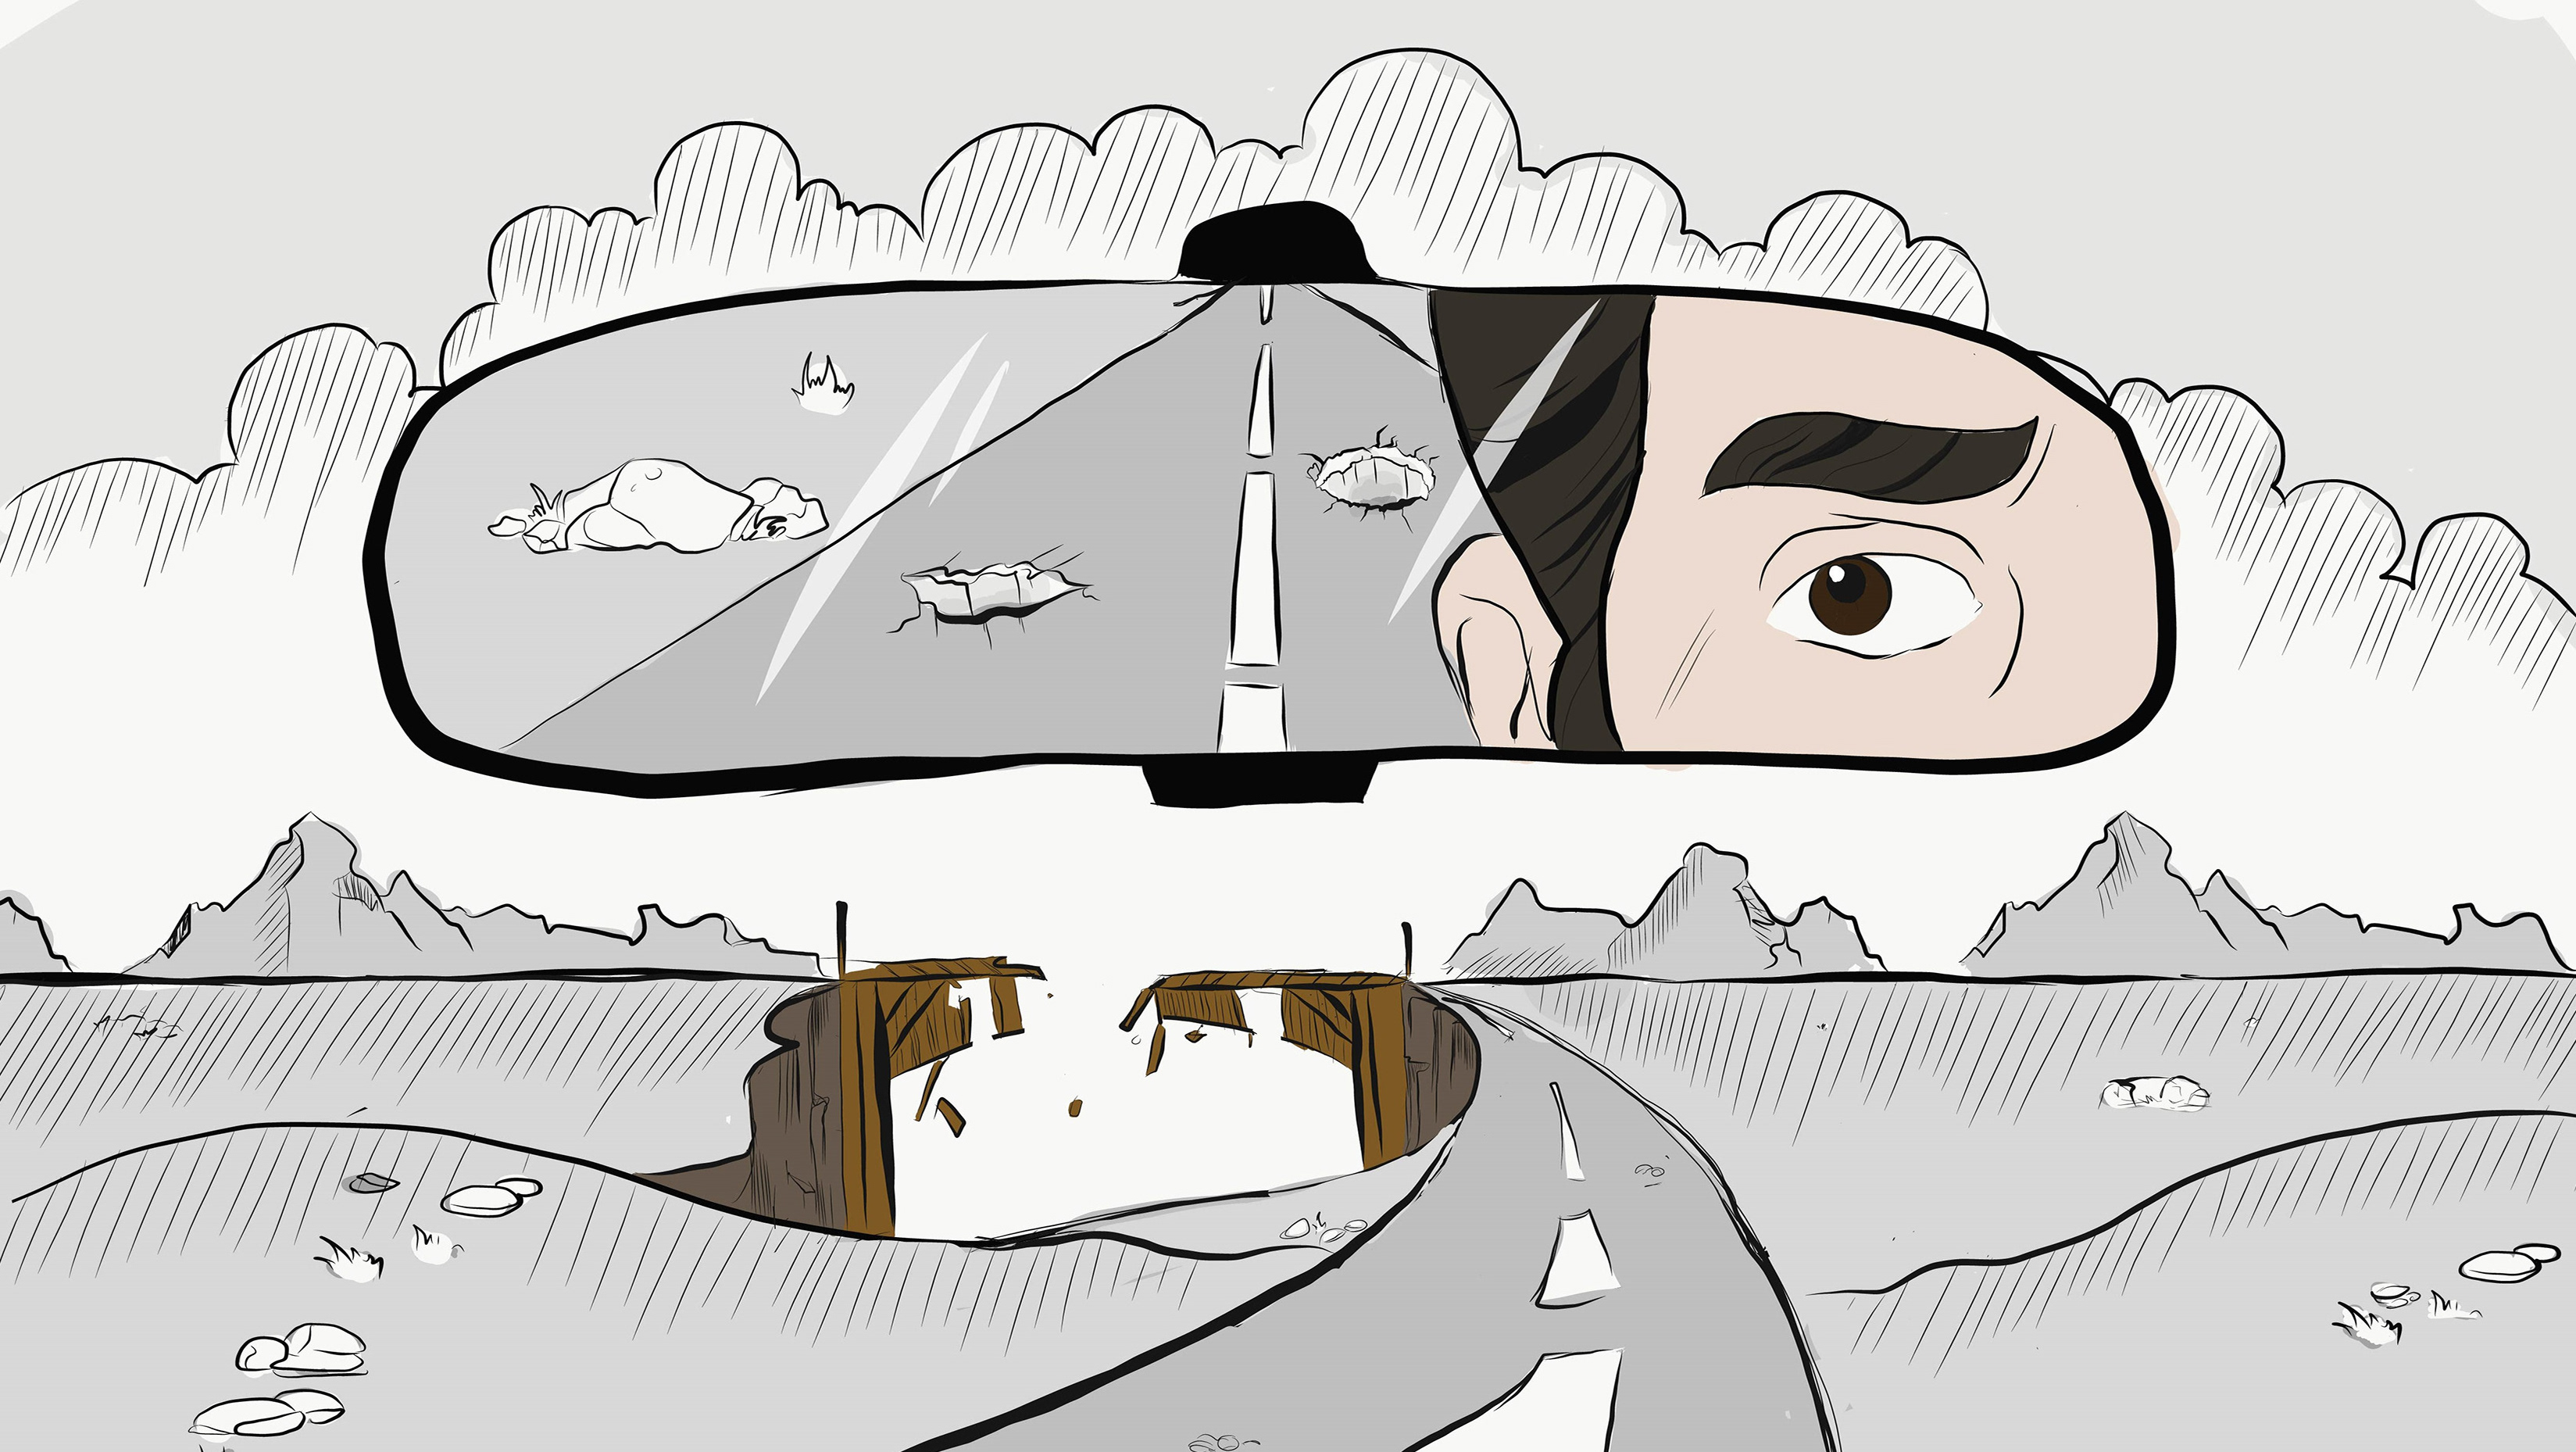
Illustrations for projects (MISC)
2022
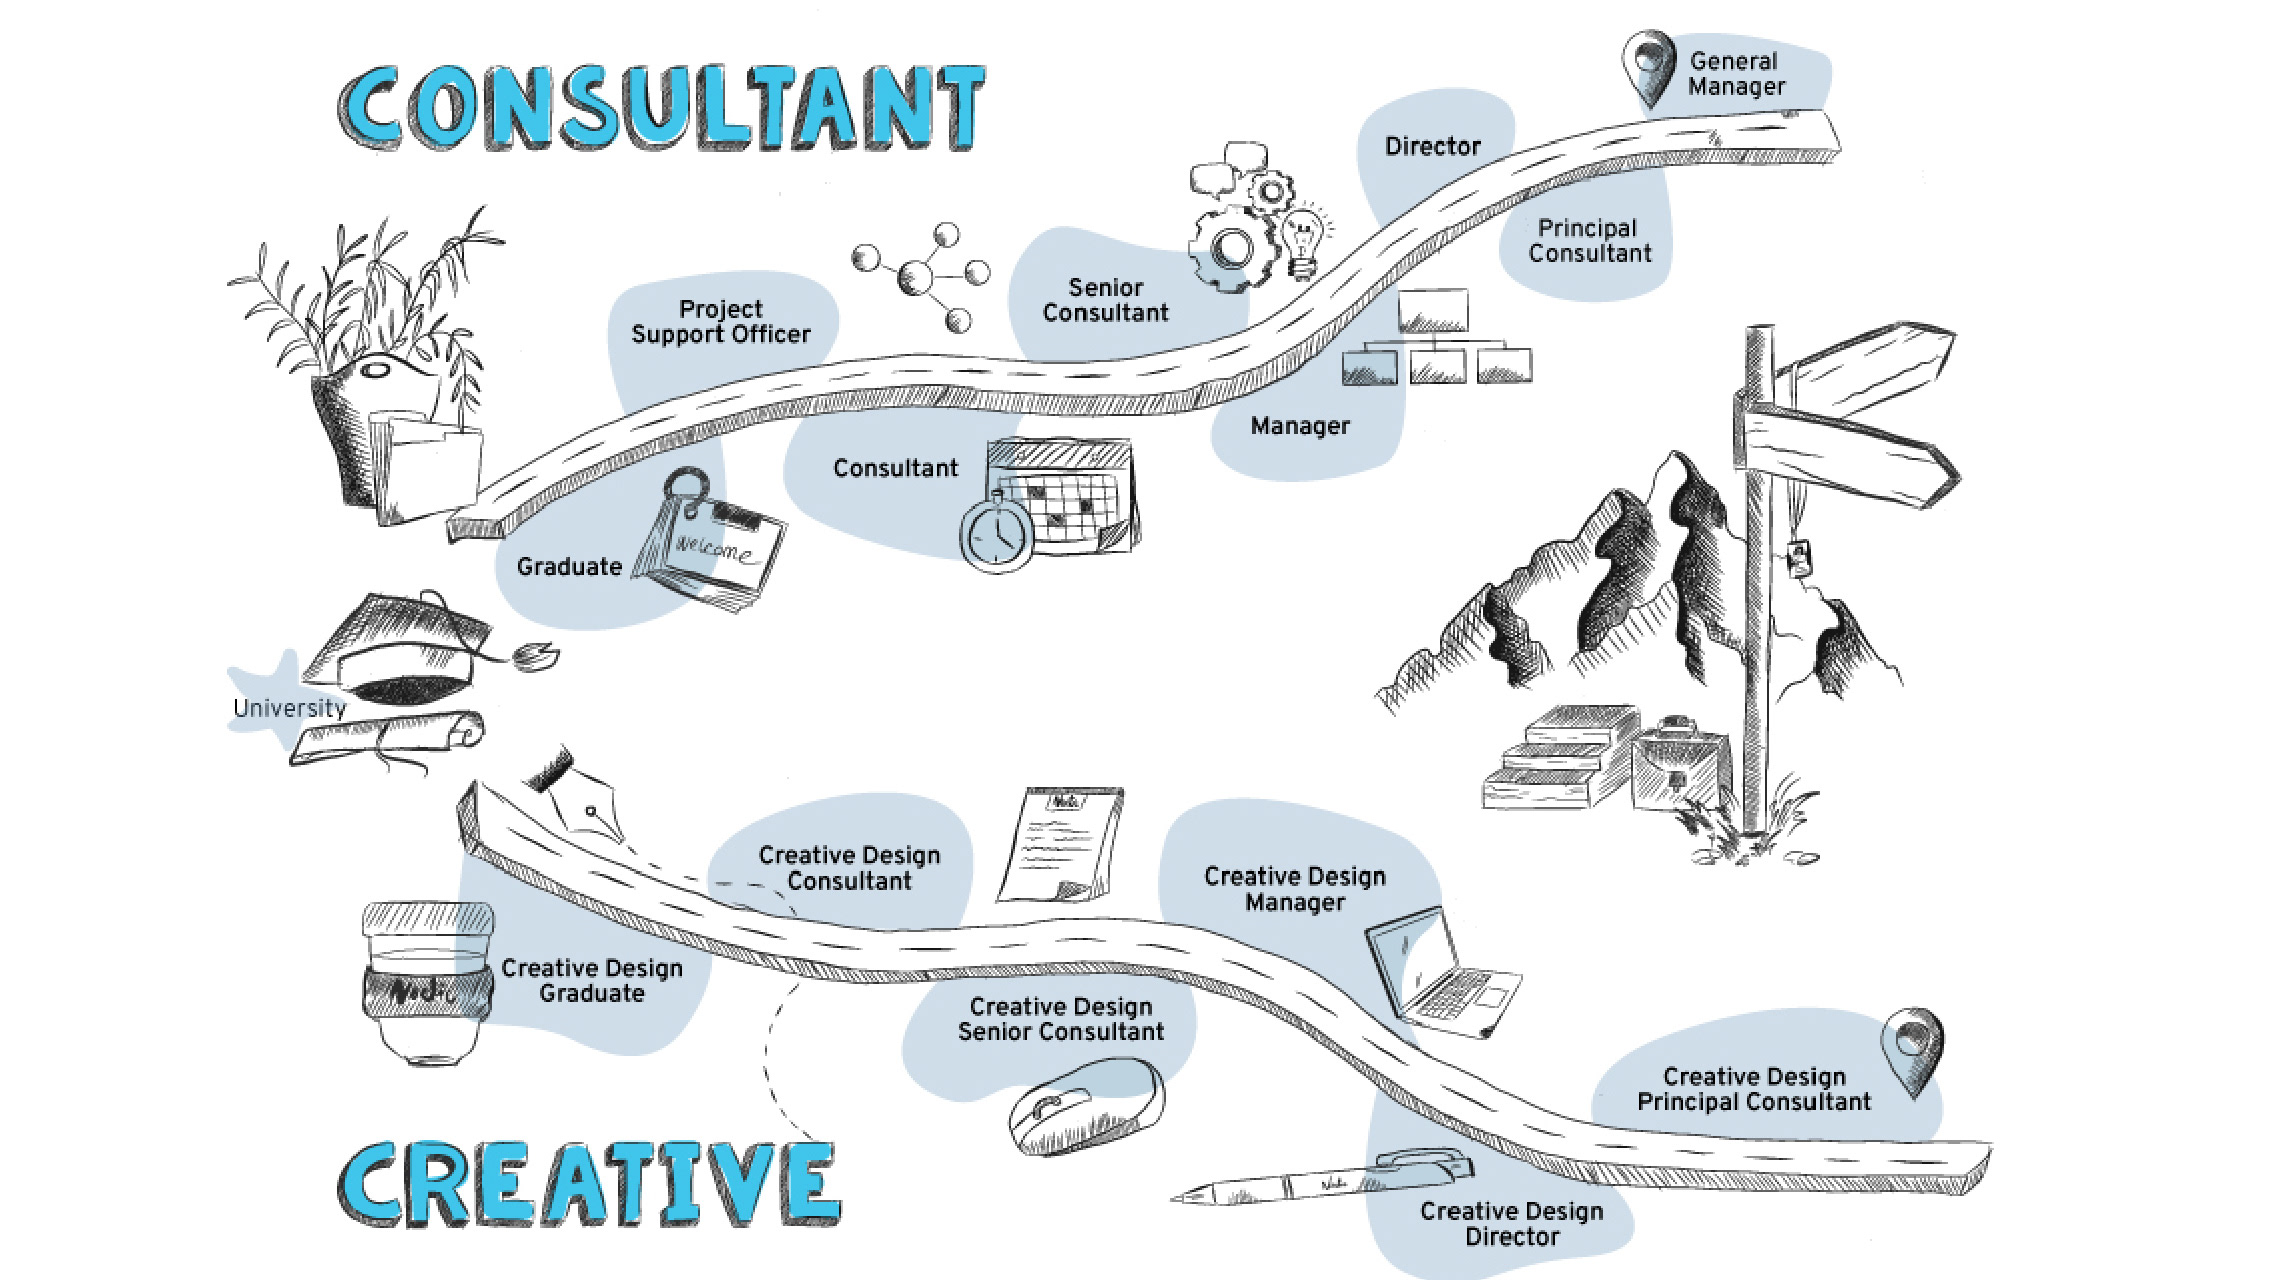
Graduate Pathway Diagram
2022

Brand Relaunch (Signage and Stationary)
2021
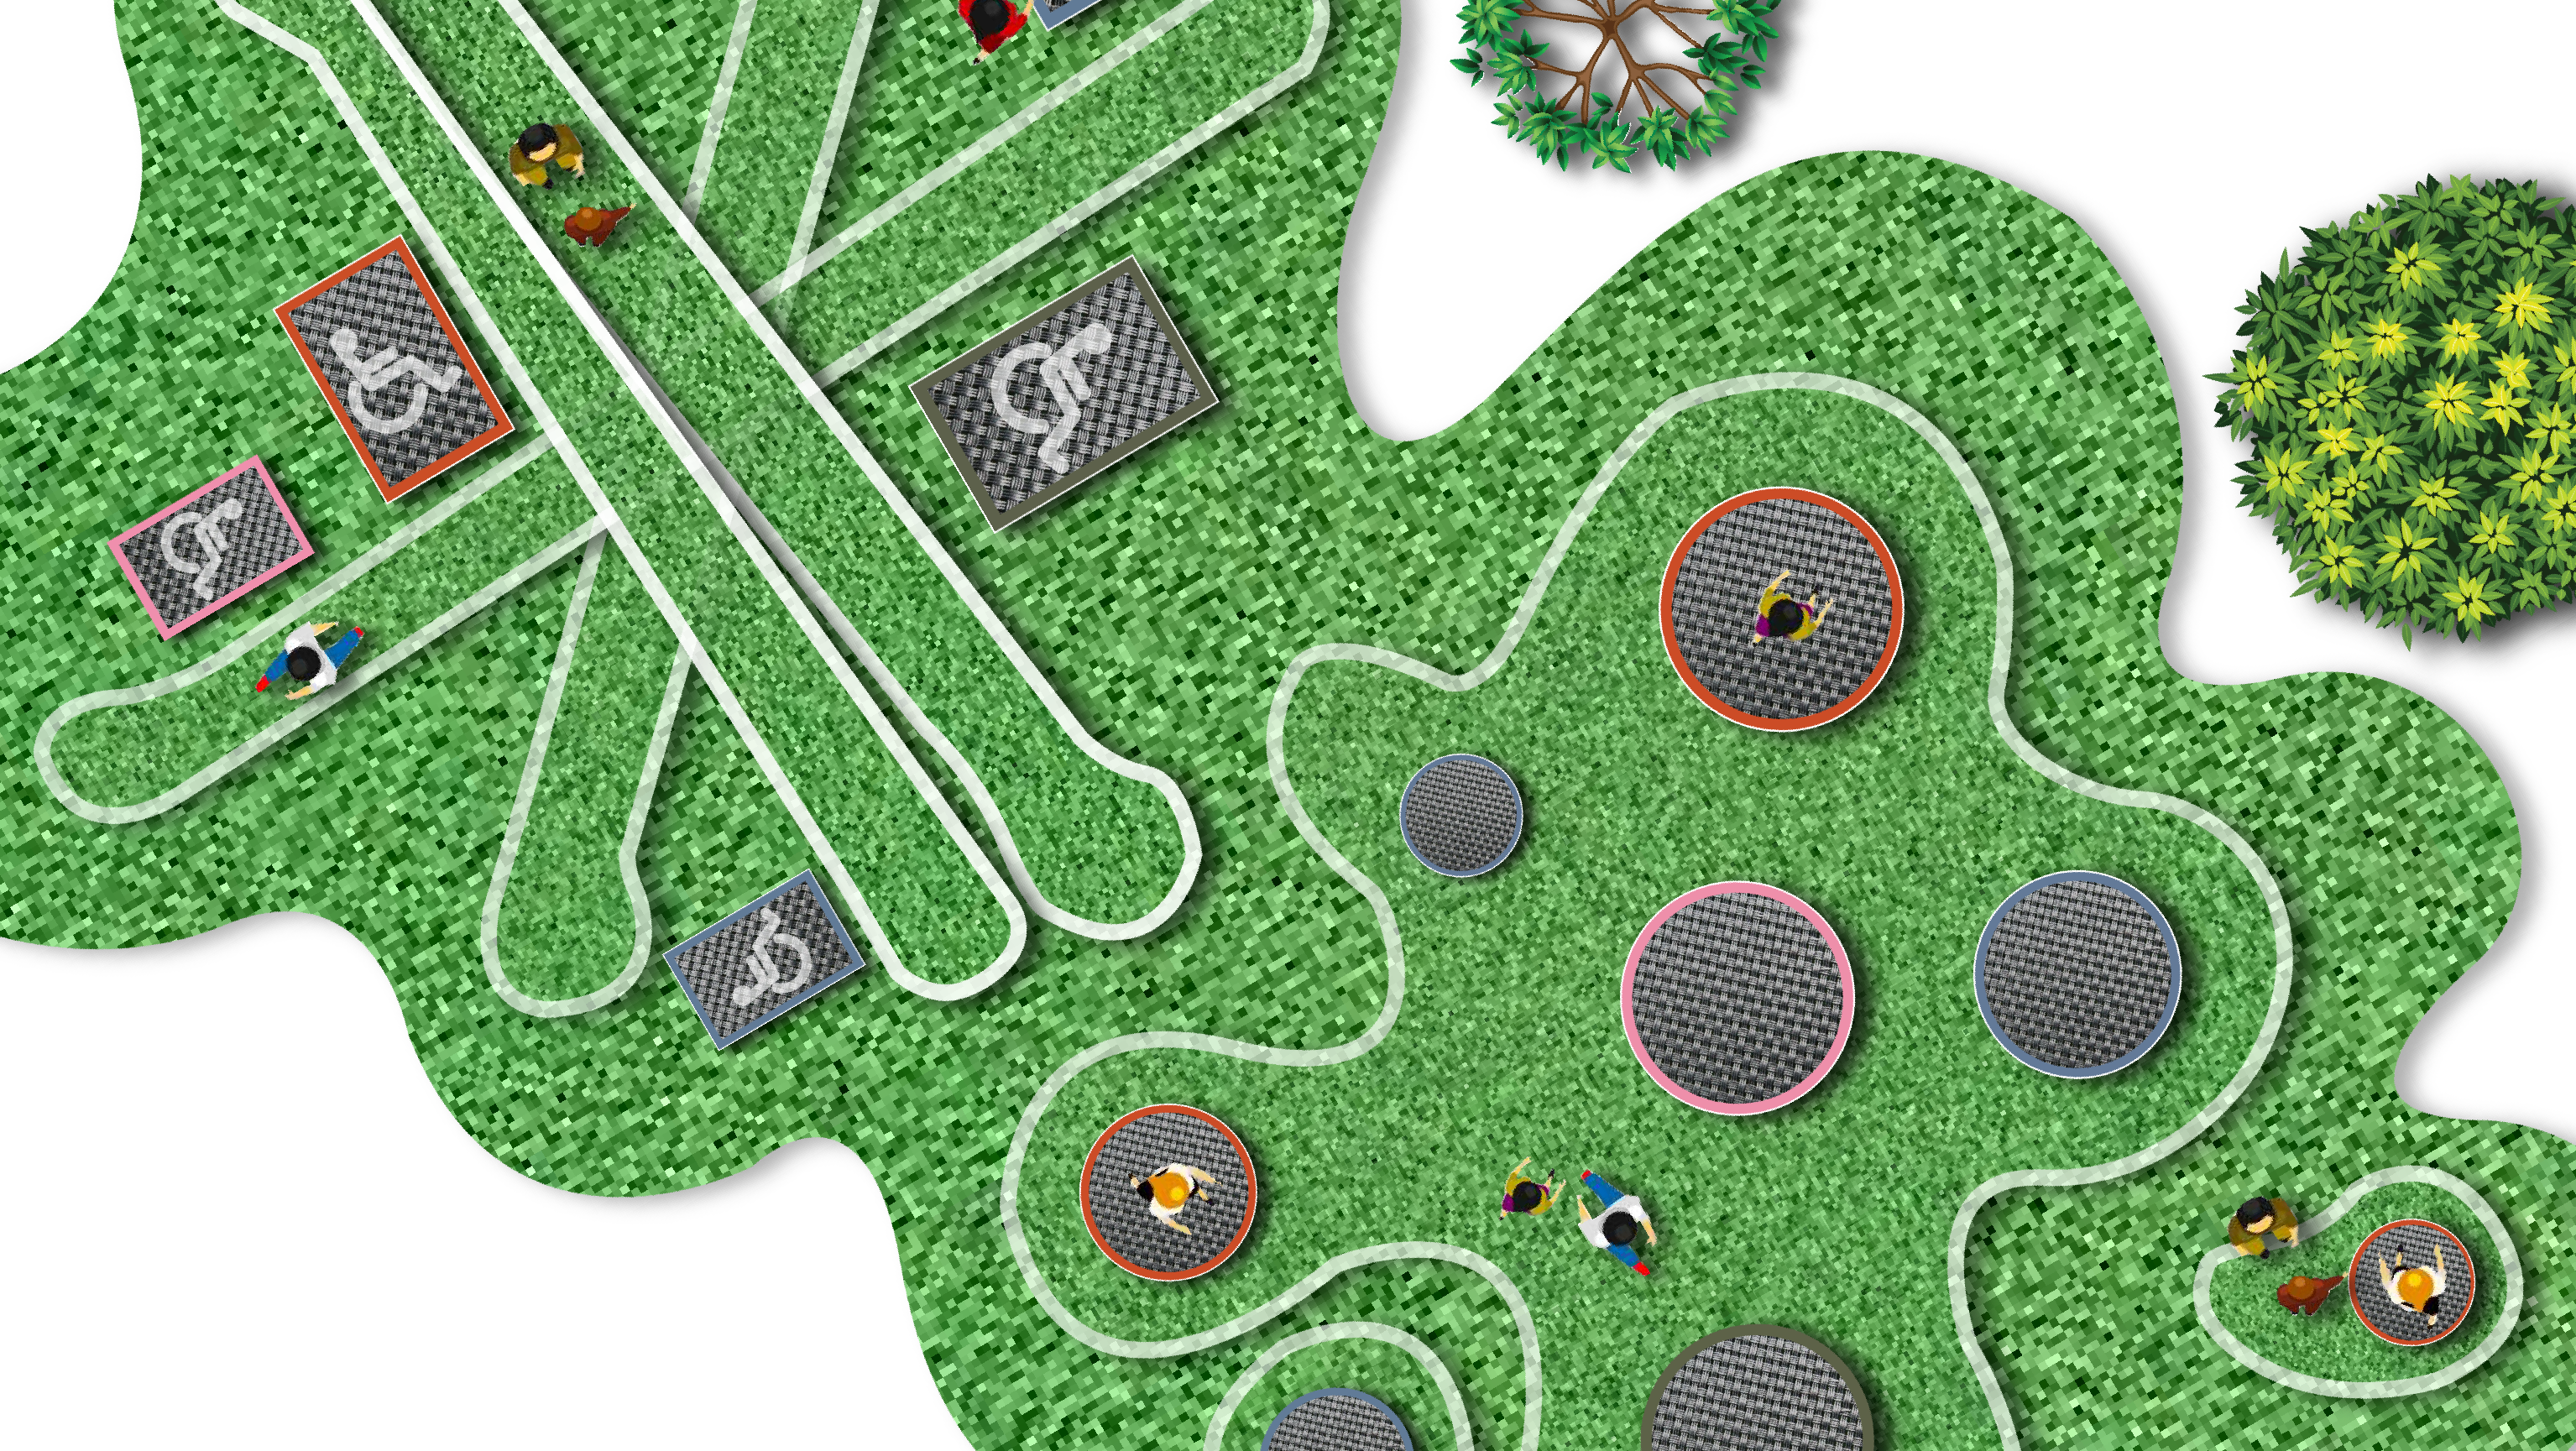
Intergenerational Play Area Project
2020
